

As a digital marketing agency, providing clear, actionable insights to your clients is critical for long-term success. SEO quarterly reports are an essential tool to showcase your work, demonstrate the value you bring, and set the stage for future collaboration. In this comprehensive guide, we’ll explore how to create the best quarterly SEO reports for clients that don’t just highlight numbers but tell a compelling story of growth and opportunity.
Why SEO Quarterly Reports Matter
A well-crafted quarterly report does more than summarize metrics; it educates, informs, and aligns clients with your strategies. It ensures transparency and builds trust while making your efforts tangible to stakeholders who may not be SEO experts.

Key Benefits of SEO Quarterly Reports:
- Showcasing Results: Demonstrating the ROI of SEO investments is critical for maintaining client trust and securing ongoing collaboration. A well-structured report turns raw data into a compelling story of success. This ensures that clients can see the value your strategies are adding to their business outcomes, such as increased revenue, lead generation, or enhanced brand visibility.
- Educating Clients: SEO can often seem like an enigma to those unfamiliar with its intricacies. Quarterly reports provide an excellent opportunity to simplify technical SEO insights into accessible, digestible points. Explaining how rankings, traffic, and conversions are interconnected allows clients to understand the importance of the work you’re doing better.
- Setting Expectations: By aligning on current progress and future goals, quarterly reports establish a roadmap that prevents miscommunication or unrealistic expectations. This clarity is crucial, as it avoids potential friction caused by misunderstandings about timelines or expected outcomes. It also helps to keep all stakeholders on the same page.
- Identifying Opportunities: SEO is a dynamic field influenced by frequent algorithm updates, emerging market trends, and shifting consumer behaviors. Reports help pinpoint areas for improvement—such as content gaps, high-potential keywords, or technical bottlenecks—and enable proactive strategies to capture untapped opportunities. This positions your agency as forward-thinking and solution-oriented.
- Building Accountability: A detailed report ensures that everyone involved is on the same page. Clients see the work being done, and you can set realistic expectations about results and timelines. Accountability fosters trust, ensuring that clients feel confident in your approach and commitment.
- Strengthening Partnerships: Consistent, high-quality reports reinforce your credibility as a partner. They help clients appreciate the expertise, effort, and strategic vision behind their SEO strategy. When clients feel valued and informed, they are more likely to renew contracts and even recommend your services to others.
Why Your Clients Need Quarterly Reports:
- Justify Their Investment: Clients want to know their resources are being allocated effectively. By connecting SEO efforts to key performance indicators (KPIs) like traffic, conversions, and revenue, you reinforce the value of your services. Highlighting precise, measurable results reassures clients that their investment is paying off.
- Provide Clarity: For non-technical stakeholders, an SEO report bridges the gap between industry jargon and business impact. Simplified data ensures that even those unfamiliar with SEO can grasp how your efforts contribute to their goals.
- Highlight Opportunities for Growth: Showing areas where performance can improve or where potential lies untapped positions your agency as forward-thinking and proactive. Clients will appreciate knowing that you’re not only tracking current performance but also planning for future growth.
- Strengthen Relationships: A regular reporting cadence fosters open communication, positioning your agency as a trusted partner. Consistent updates demonstrate your dedication to transparency and collaboration.
- Establish Strategic Planning: Quarterly reports help your team and the client collaborate on future strategies, aligning on tactics to reach specific objectives. They provide a foundation for brainstorming sessions, resource allocation, and long-term goal setting.
The Anatomy of the Best Quarterly SEO Reports for Clients
- Provide a high-level overview of key wins, challenges, and next steps.
- Emphasize metrics that align with your client’s specific goals (e.g., revenue growth, brand visibility).
- Be concise yet impactful, encouraging the client to dive deeper into the report.
- Organic Traffic Growth: Use Google Analytics to highlight traffic trends over time. Showcase how traffic changes relate to specific campaigns or SEO updates.
- Keyword Rankings: Track movements for high-priority keywords to demonstrate progress. Tools like SEMrush or Ahrefs can visualize keyword trends effectively.
- Click-through Rates (CTR) and Bounce Rates: Provide insights into user behavior. Analyze changes in CTR and bounce rates to refine calls to action (CTAs) and optimize landing pages.
- Conversion Rates: Tie traffic growth to tangible outcomes like leads, sign-ups, or sales. Highlighting the connection between SEO efforts and business growth resonates deeply with clients.
- Engagement Metrics: Include metrics like average session duration, time on page, and pages per session. These provide a clear picture of user interactions and content engagement.
- Mobile Performance Metrics: Mobile continues to dominate web traffic. Include mobile-specific metrics like page load speed, mobile bounce rates, and mobile conversion rates. Insights here can guide mobile-first optimization efforts.

- Quarter-over-quarter (QoQ) comparisons reveal short-term trends and immediate improvements.
- Year-over-year (YoY) trends highlight longer-term growth and seasonal patterns.
- Benchmarks against industry standards help clients understand their relative performance.
- Highlight Key Campaigns: Provide insights into the campaigns that drove the most success. Whether it’s content creation, technical optimizations, or outreach efforts, give credit where it’s due.
- Share Results: Back up your claims with data. For instance, “Our link-building campaign secured 25 high-authority backlinks, increasing domain authority by 3 points.”
- Illustrate Creativity: Showcase innovative solutions, such as an interactive content piece or a unique keyword cluster that yielded unexpected traffic.
- Analyze Seasonal Campaigns: If relevant, explain how seasonality impacted performance and what adjustments were made to capitalize on trends.

- Domain Authority Comparisons: Show how the client’s authority measures up within their industry.
- Backlink Analysis: Compare backlink profiles to uncover gaps and opportunities.
- Keyword Competitiveness: Highlight which keywords competitors are ranking for that your client isn’t targeting yet.
- Trending Content Topics: Identify topics gaining traction in the client’s niche and suggest how to leverage these insights for content creation.
- SERP Visibility: Use SERP screenshots to illustrate where competitors appear and what improvements are needed for the client to gain visibility.
Providing actionable insights alongside competitive data helps clients see you as proactive and strategic.
This section bridges the gap between data and strategy. Recommendations should be practical, relevant, and specific. Examples include:
- Content Strategies: Suggest content clusters, blog topics, or video formats to target emerging trends.
- Technical Fixes: Offer detailed steps for addressing site speed issues, broken links, or duplicate content.
- Keyword Targeting: Identify untapped keyword opportunities, including long-tail variations.
- Link-building Opportunities: Highlight potential partnerships or guest posting opportunities to strengthen the backlink profile.
- Mobile Optimization: Recommend improvements tailored to mobile users, such as AMP implementation or enhanced mobile-friendly designs.
Include timelines and prioritize recommendations. For example, label tasks as “Immediate,” “Next Quarter,” or “Future Consideration.” Clear prioritization ensures that clients know where to focus their resources.
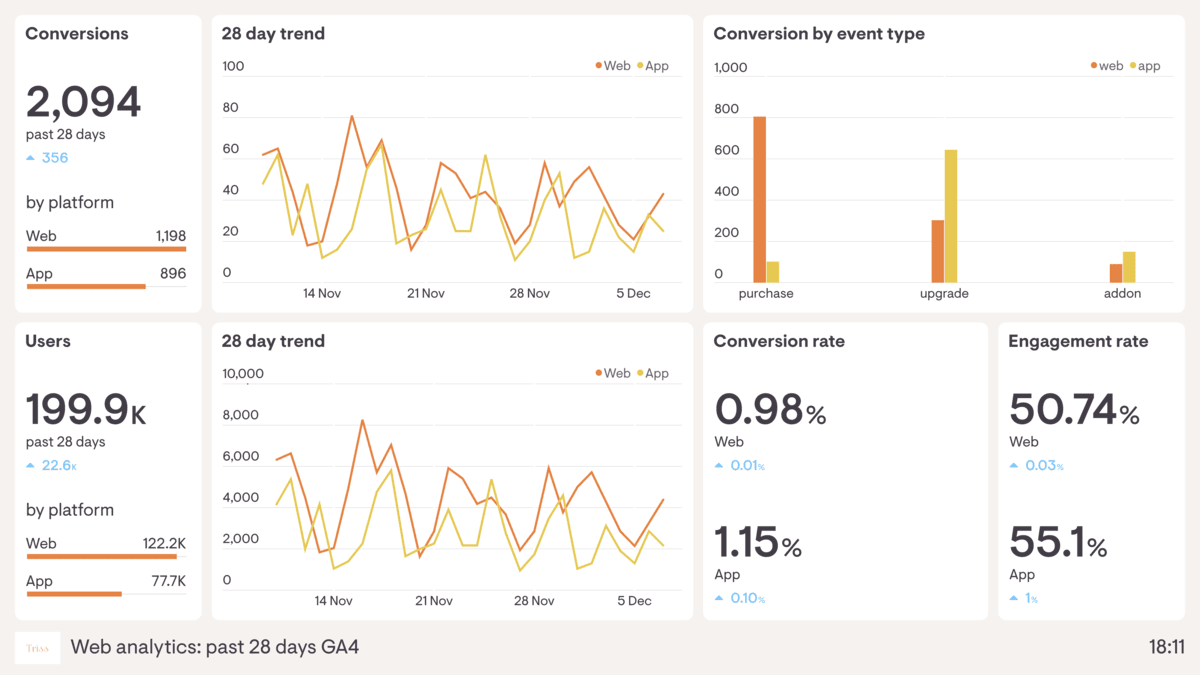
Visuals are crucial for breaking down complex data. Use them to:
- Simplify Metrics: Charts and graphs make trends and comparisons easier to interpret.
- Highlight Achievements: Screenshots of SERPs, improved rankings, or successful campaigns make achievements tangible.
- Enhance Storytelling: Infographics and timelines can summarize strategies and their outcomes engagingly.
- Illustrate User Behavior: Heatmaps and session recordings can provide a deeper understanding of how visitors interact with the site.
1. What Metrics Should Be Included in a Quarterly SEO Report?
Organic Traffic:
- Show trends over the quarter and compare them to the previous quarter. Highlight different segments, such as mobile versus desktop users or new versus returning visitors. For example, a significant increase in mobile traffic might indicate the success of mobile optimization strategies.
- Break down traffic by source (e.g., search engines, social media, referral sites) to give a clearer picture of where visitors are coming from.

- Display movement for high-priority keywords, including those with high search volumes or critical business importance.
- To show how improvements impact visibility, add context to rankings, such as competition level or estimated traffic potential.
- Include emerging keywords where the client’s content is gaining traction, signaling new opportunities.
- Summarize the quantity and quality of new backlinks acquired. Highlight backlinks from high-domain authority sites or relevant industry sources.
- Showcase how new backlinks contribute to improving the site’s authority and boosting rankings.
- Identify opportunities for further link-building efforts based on competitors’ backlink profiles.
- Track user behavior through metrics such as time on site, pages per session, and bounce rates.
- Identify pages with high engagement as examples of successful content and analyze pages with low engagement to pinpoint areas for improvement.
- Showcase how SEO efforts translate into measurable business outcomes, such as leads, sign-ups, or sales. For example, highlight the percentage of organic visitors who completed a contact form or made a purchase.
- Include conversion rates broken down by device type to understand how different users interact with the site.
- Highlight load times and areas for improvement, as they directly impact user experience and rankings. For example, “Improving load times by 1 second could reduce bounce rates by 20%.”
- Identify which blog posts, landing pages, or media assets drove the most traffic and engagement. Discuss why certain pieces performed well and how to replicate that success.
- Include recommendations for updating or repurposing underperforming content to align with current trends or search intent.
2. How Can You Present Data Effectively to Clients?

- Use bar graphs, pie charts, and line graphs to simplify complex data. For example, a line graph can clearly show traffic growth over time.
- Heatmaps and scroll maps can visually represent user behavior, highlighting which parts of a page are most engaging.
- Explain why a metric matters and what influenced its performance. For instance, “Bounce rates decreased by 10% after we improved the site’s navigation and reduced page load times.”
- Provide actionable insights based on data trends. For example, “Pages with high engagement suggest that expanding similar topics could drive further traffic.”
- Include screenshots of SERP results showing improved rankings.
- Share examples of successful campaigns, such as a blog post that ranked on page one for a high-value keyword.
- Avoid jargon and use simple, relatable terms. Instead of saying, “CTR dropped due to SERP volatility,” explain, “There were fewer clicks because competitors’ ads pushed our client’s link lower in the results.”
- Provide clients with access to live dashboards, allowing them to explore data at their convenience. Tools like Google Data Studio make it easy to create customized, real-time reports.
3. What Tools Are Best for Generating SEO Data?
- Tracks website traffic, user behavior, and conversions. Use it to identify trends and understand how users interact with the site.

- Monitors keyword rankings, crawl errors, and technical issues. Provides insight into how Google indexes the site.
- Comprehensive tools for competitive analysis, keyword research, backlink audits, and more.
- Use them to identify competitor strategies and uncover opportunities for improvement.
- A powerful site auditing tool that identifies technical issues such as broken links, duplicate content, and missing metadata.
- Allows you to create visually appealing, customizable dashboards to present data effectively.
- Tracks user behavior through heatmaps and session recordings, providing insights into how visitors navigate the site.
- A versatile tool for rank tracking and competitor benchmarking. Use it to monitor progress and maintain an edge over competitors.
- Provides enterprise-level insights into content performance, keyword opportunities, and competitive intelligence.
4. How Do You Customize Reports for Different Clients?
- Prioritize metrics based on their objectives, such as brand visibility for a new business or revenue growth for an e-commerce site.
- Align your reporting with their KPIs to emphasize the progress made toward achieving their goals.
- Compare the client’s performance against industry norms to provide context. For instance, “Your average session duration is 20% higher than the industry benchmark.”
- Offer actionable insights that directly address their challenges. For example, “To improve mobile conversions, we recommend redesigning the checkout process for faster input.”
- Please share examples of similar successes in their industry to build confidence in your strategies. Highlight how previous clients overcame identical challenges.
- While quarterly reports are standard, some clients may benefit from additional monthly updates or real-time dashboards for critical campaigns.
5. What Should the Call-to-Action in an SEO Report Include?
- Highlight the most significant achievements and areas for improvement. For example, “This quarter’s strategies resulted in a 25% increase in organic traffic and a 15% improvement in conversion rates.”
- Lay out actionable recommendations for the upcoming quarter. For instance, “Our next focus will be on creating a content hub targeting high-traffic keywords.”
- Encourage clients to discuss the report in detail and align on priorities. “Let’s schedule a call next week to strategize the next phase of the campaign.”
- Propose enhancements such as investing in content marketing, launching paid campaigns, or conducting a deeper technical audit. “Investing in a targeted link-building campaign could further boost rankings for your top-performing keywords.”
Best Practices for Creating Quarterly SEO Reports

- Keep It Client-Centric: Align everything with the client’s business objectives.
- Avoid Jargon: Use language that clients can understand.
- Focus on Trends Over Time: Highlight progress and patterns to tell a story.
- Highlight Wins and Challenges: Be transparent about successes and hurdles, offering solutions for the latter.
- Update Formats Regularly: Adapt to client feedback for improved comprehension and relevance.
- Incorporate Multimedia: Adding videos or interactive dashboards can make reports more engaging.
Template for the Best Quarterly SEO Report
- Client name and logo.
- Reporting period.
- Key wins.
- Top priorities for the next quarter.
- Traffic, rankings, and engagement data.
- Visuals for key metrics.
- Details of top-performing campaigns.
- Lessons learned.
- Comparison with competitors.
- Opportunities to capitalize on.
- Action steps for improvement.
- Resources needed to achieve goals.
- Recap of the report.
- Schedule a follow-up meeting or propose the next steps.
Final Thoughts
Creating the best quarterly SEO reports for clients involves more than crunching numbers. It’s about weaving data into a compelling narrative that highlights your agency’s expertise and the value you bring. By focusing on clarity, relevance, and actionable insights, you can build stronger relationships and drive better results.

Ready to elevate your SEO strategy? Contact Excell today and book a free discovery call
Contact us:
EXCELL INDUSTRIES LLC
6420 Richmond Ave., Ste 470
Houston, TX, USA
Phone: +1 832-850-4292
Email: info@excellofficial.com